
Infinitypool
UX RESEARCH - UI DESIGN - STYLE GUIDES - ITERATIVE DESIGN
From 2020 to 2021, I worked on a data labeling application designed for rapid and collaborative labeling to support supervised machine learning projects. I delved into every aspect of the design process multiple times in order to support several fully-functioning, complex data-labeling features like: computer vision, text translation, natural language processing and text annotation, and image, text, video, and audio classification.
THE TEAM
2 designers, 2 project managers, 6 engineers
MY ROLE
Discovery research, design, user-testing, and iterative design
TIMELINE
April 2020 - Sept 2021

PROBLEM STATEMENT
Infinitypool’s original data-labeling experience was laborious and inefficient for all users involved. The lack of data-labeling models also made it primitive relative to competitors.
How might we help users want to label a higher volume of accurate data?
Personas
We conducted numerous user interviews and identified four primary user groups to design for. Each user had varying levels of technical skills and different use cases. Some users would use the application for labeling, while others would monitor the labelers or upload their own data for labeling.

Will
PM, Mid-Tech
Managing projects and dividing tasks

Carla
Active Duty, Mid-Tech
Tagging general and expert datasets

Simon
Expert Analyst, High Tech
Tagging images of aircraft parts to build an AI

Indra
Linguist, Low Tech
Uploading handwriting examples
Journey Maps
For our more complex features like Model Validation and Object Detection, we created user journey maps to visualize the exact steps and experiences a user would go through. It helped us hone in on their journey and refine specific aspects of their experience.

DESIGN
🧑🏻💻 Templates
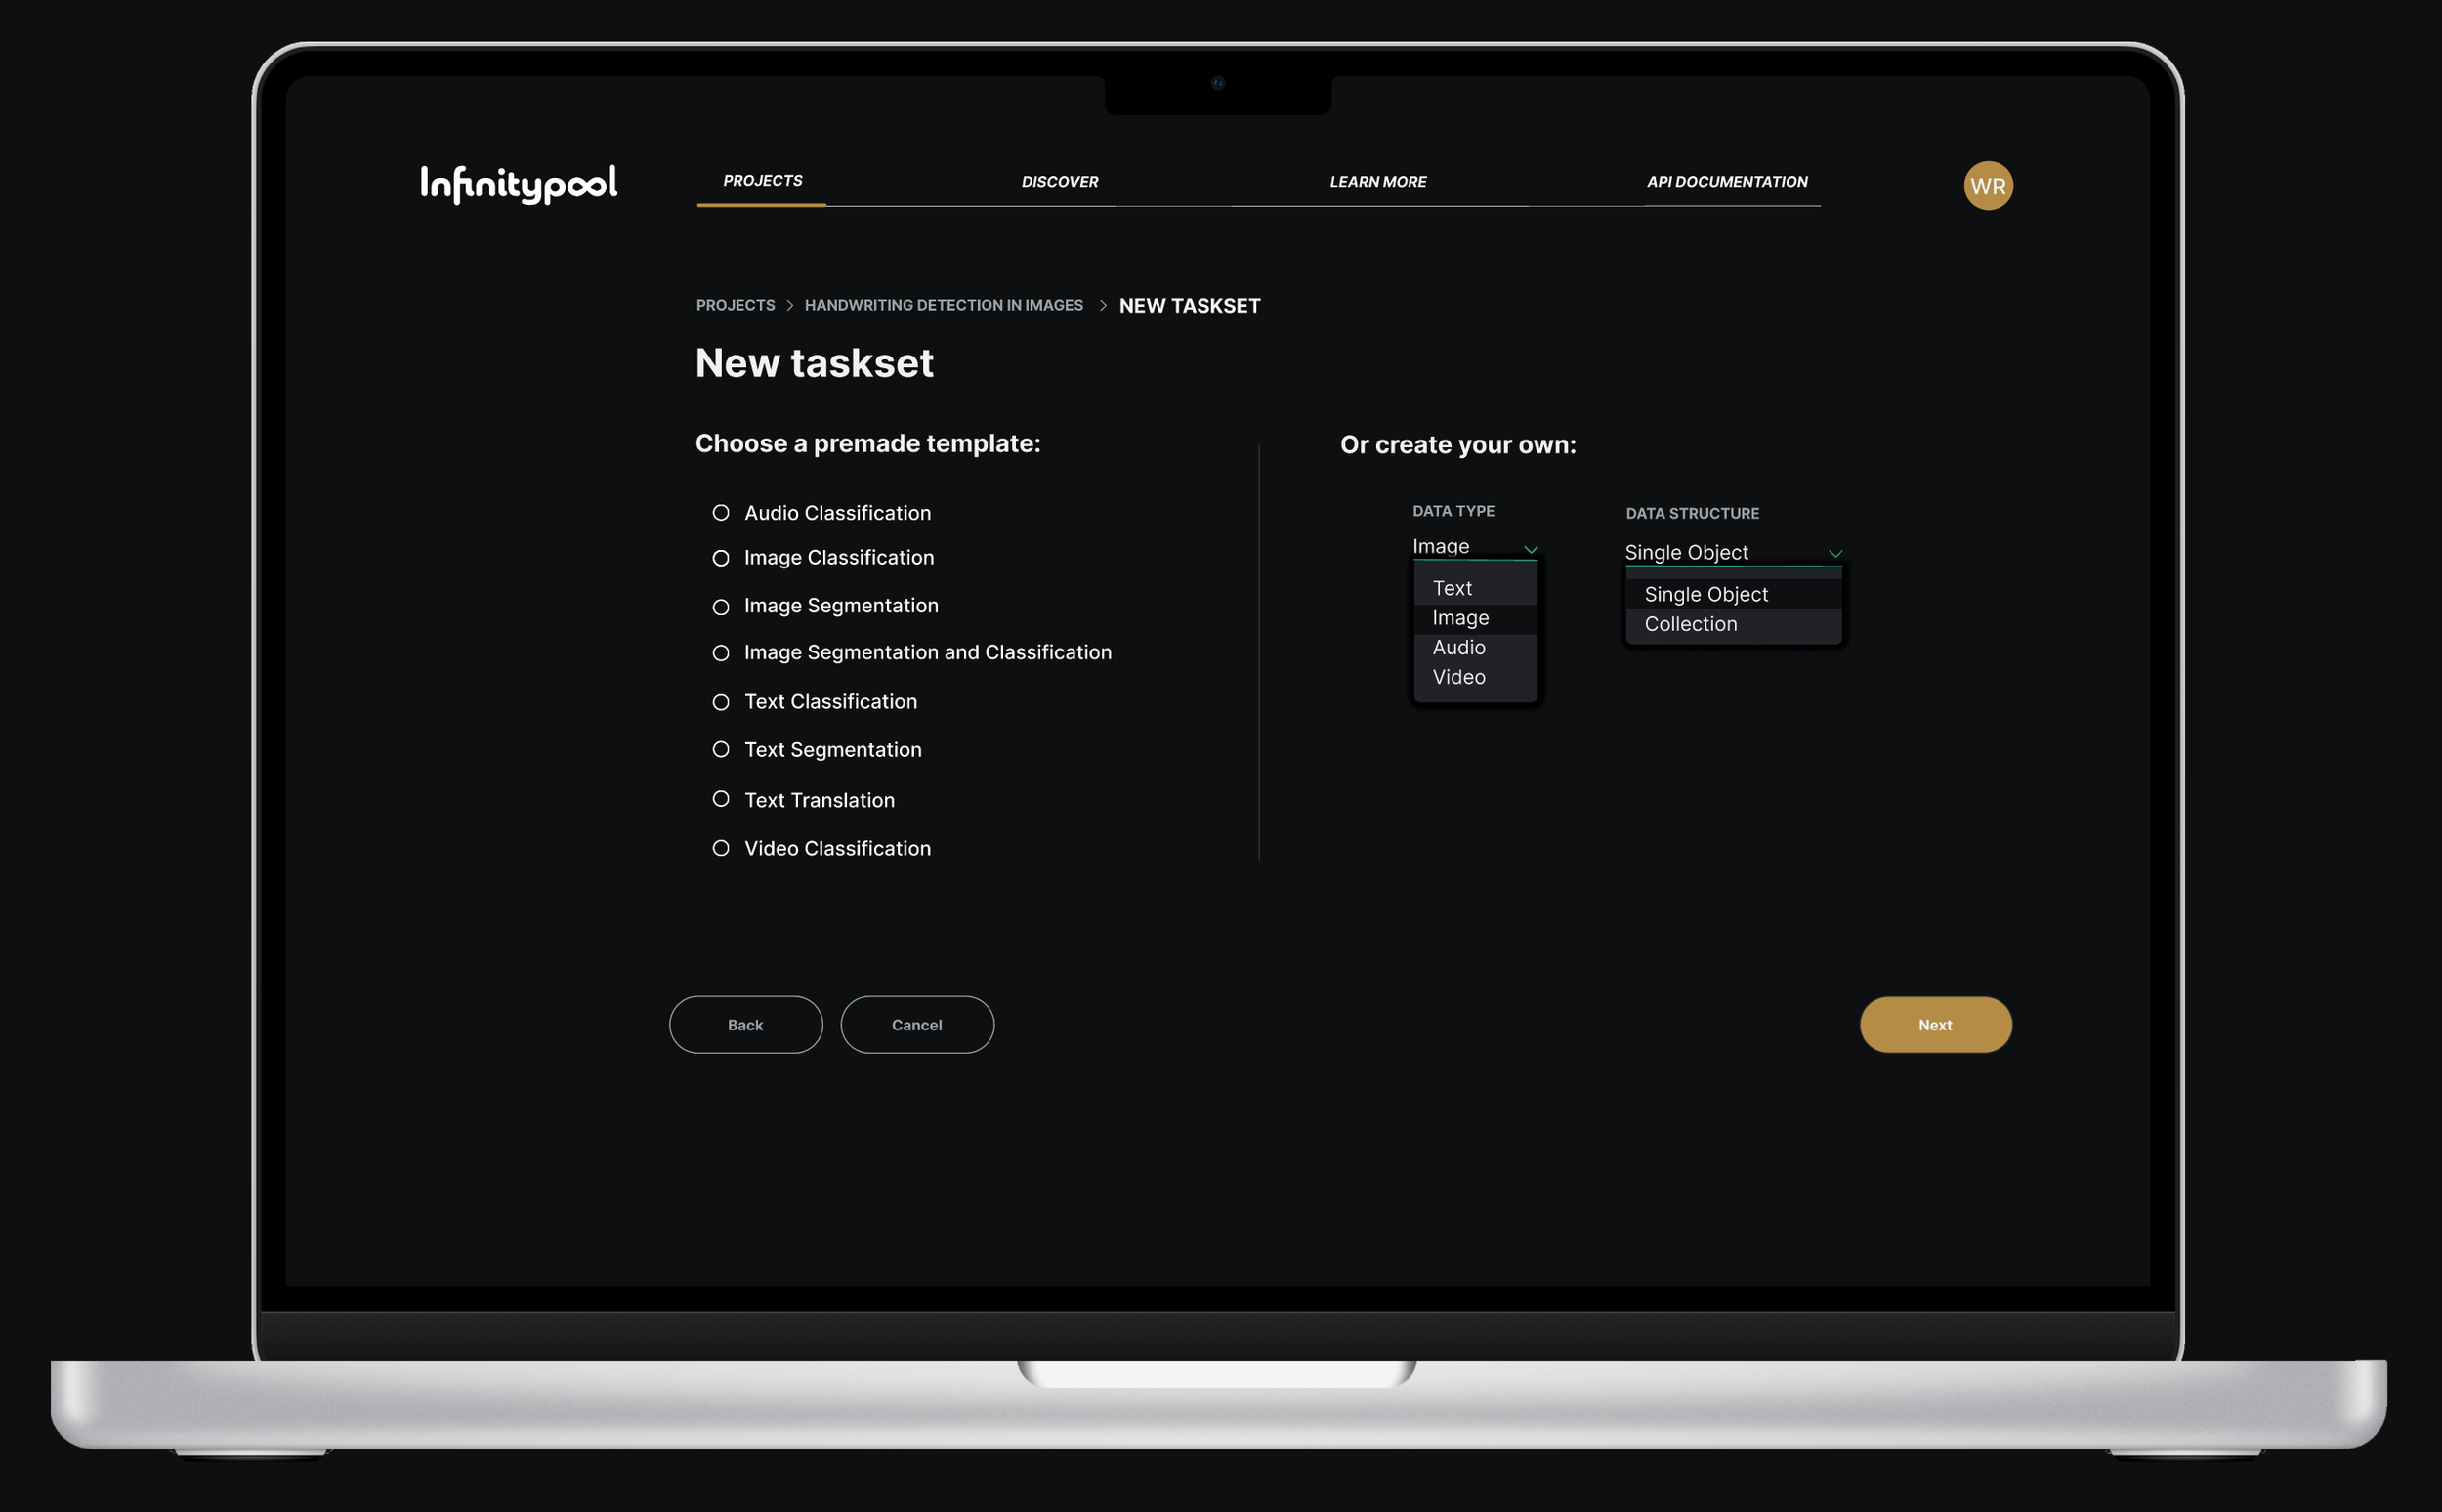
To compete, Infinitypool needed industry standard data-labeling templates. To gain an edge over the competition, Infinitypool needed to be the best at each of these types of labeling. We compiled a comprehensive list of standard templates and also provided users with options to customize their own and combine various types of data types and structures:
🔦 Light Switch
During the design of initial mockups, the need for a Dark Mode became evident. We discovered that analysts are typically labeling on a large monitor and in a dark room - this helps them label more accurately. But labeling on this bright, white screen in this setting can cause eye strain.
🏆 Friendly Competition
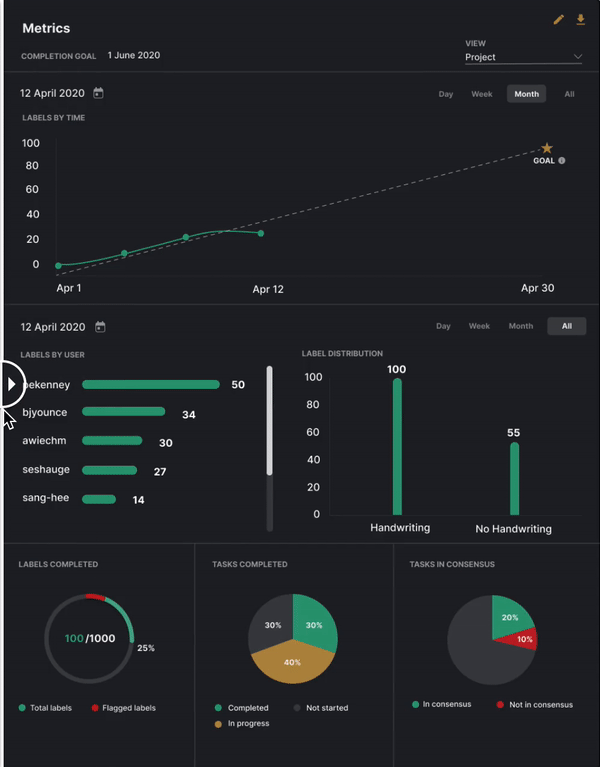
Labeling mass amounts of data can be an arduous task. We needed a way to incorporate delight into this process and received feedback from users that they would love to see how their metrics stacked up against their co-workers. The gamification feature was built out in a way that inspired users to continue labeling by adding competition:
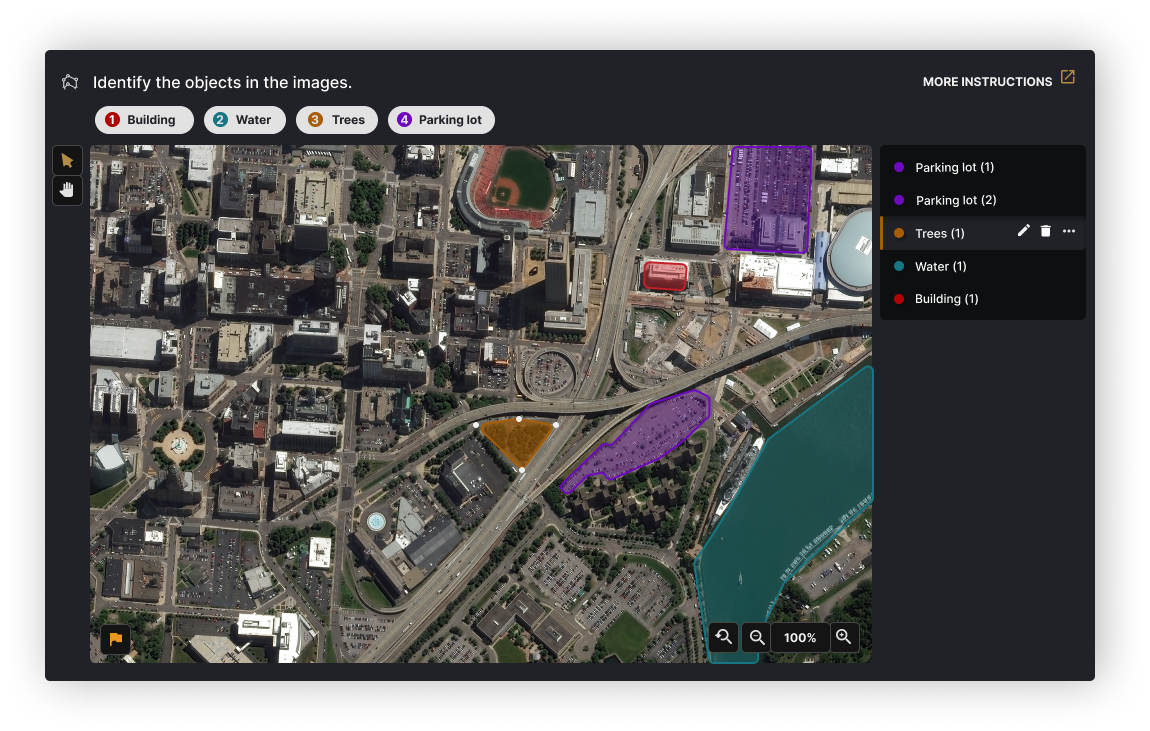
🖼 Image Segmentation
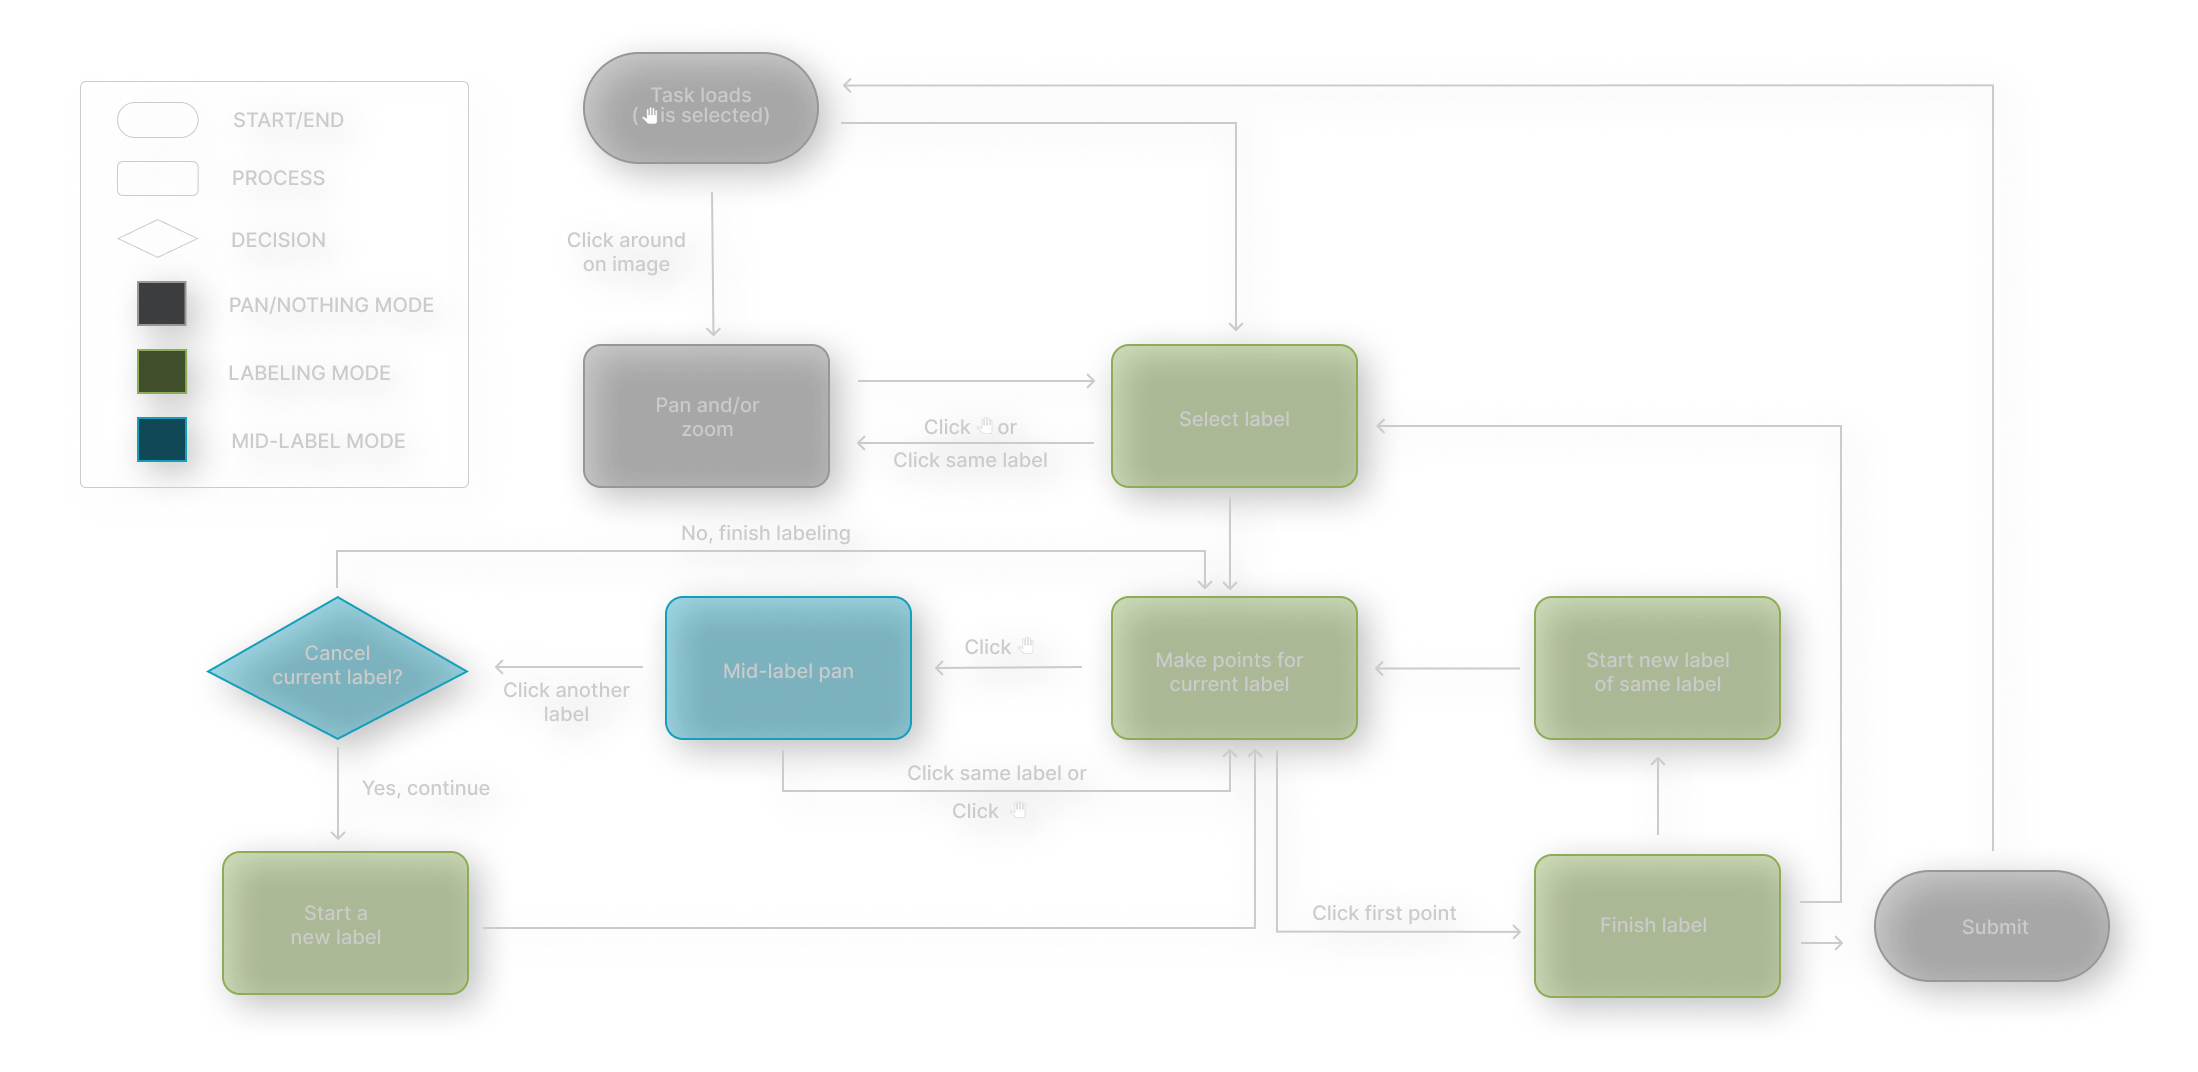
One of the more challenging features to design was Image Segmentation. I was responsible for making segmenting objects within an image a smooth experience for an Analyst. This required rounds of feedback and iterations. A task that seemed simple at first, like Panning across an image, required a detailed workflow diagram.
This workflow diagram illustrates to developers exactly what happens at each step of the Panning and Labeling process:

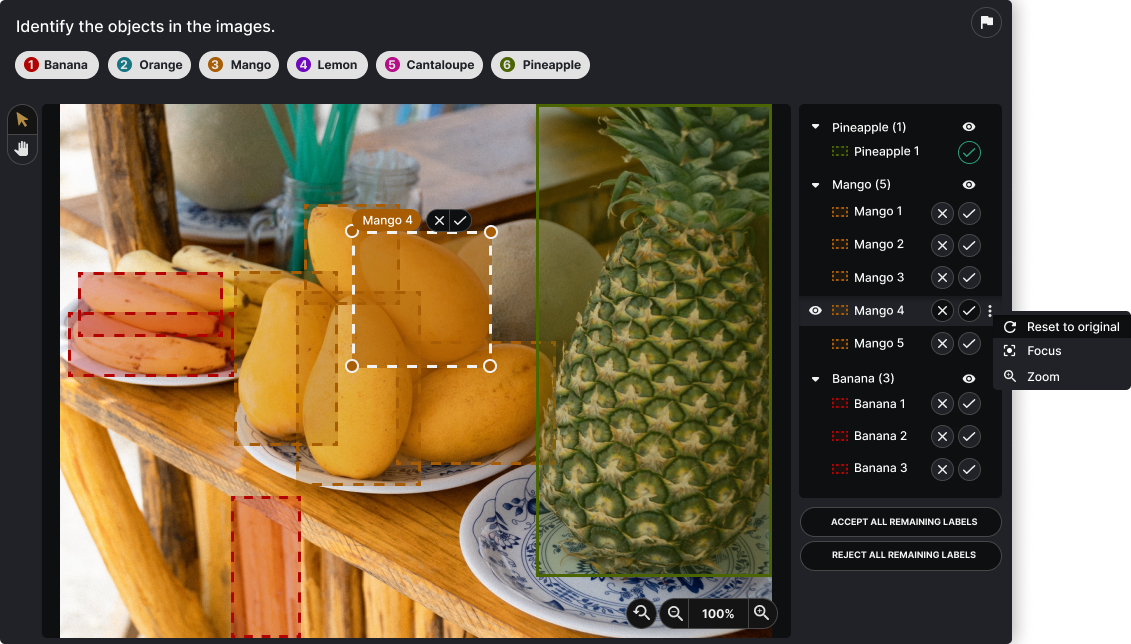
🤖 AI Automated Labeling
Further along in development, we designed a way for users to Accept or Reject Computer Vision AI automated labels. We researched and implemented Layer Contols, Hover States, and a way to mass Accept or Reject labels.

ITERATE
Usability Testing
Following the design of the initial version, we scheduled several engagement sessions with users of the application. We wrote appropriate scripts and alternated between note-taking and facilitating the usability tests.
Feature Prioritization
We created a feature prioritization list that included the feature/functionality in question, an impact score, the percentage of users the feature would affect, the number of user roles it would affect.
Those were used to calculate its overall priority rating. Features with the highest ratings guided our iteration process.